
October 2017
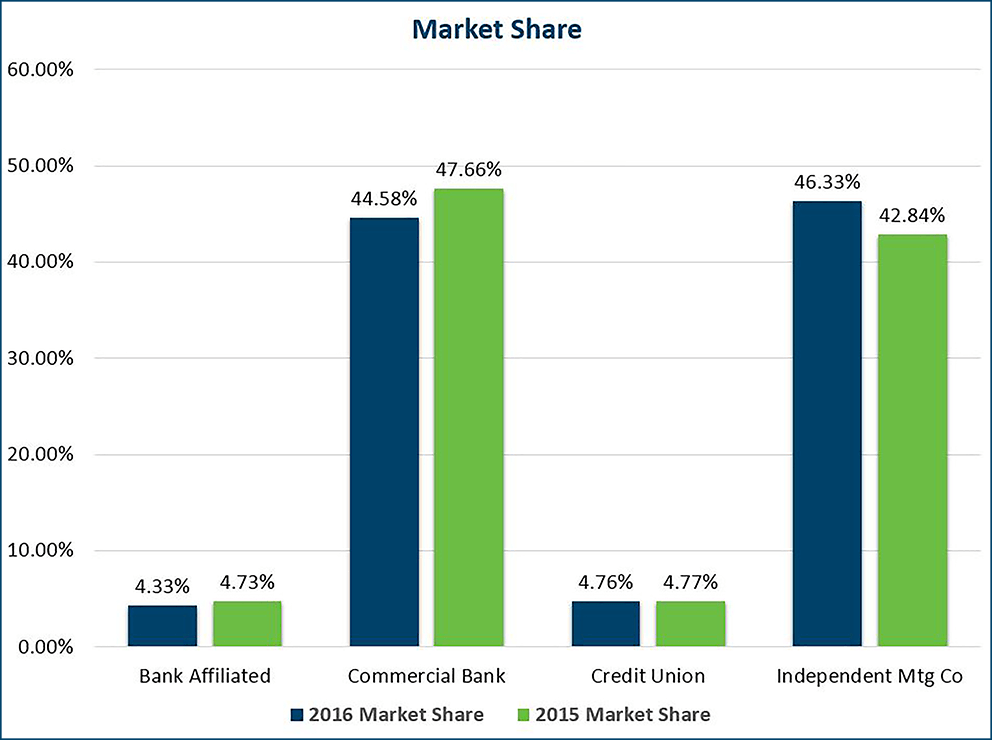
Independent mortgage companies have captured the majority market share of originations in 2016, according to the HMDA data released on September 28th. After successfully building market share over the years, independents have finally surpassed commercial banks.
Non-banks now have 46.33% of the market share in 2016, while commercial banks trail them with 44.58%. Independents experienced an increase in market share of 3.49% from 2015, while commercial banks lost 3.09% in market share from 2015.
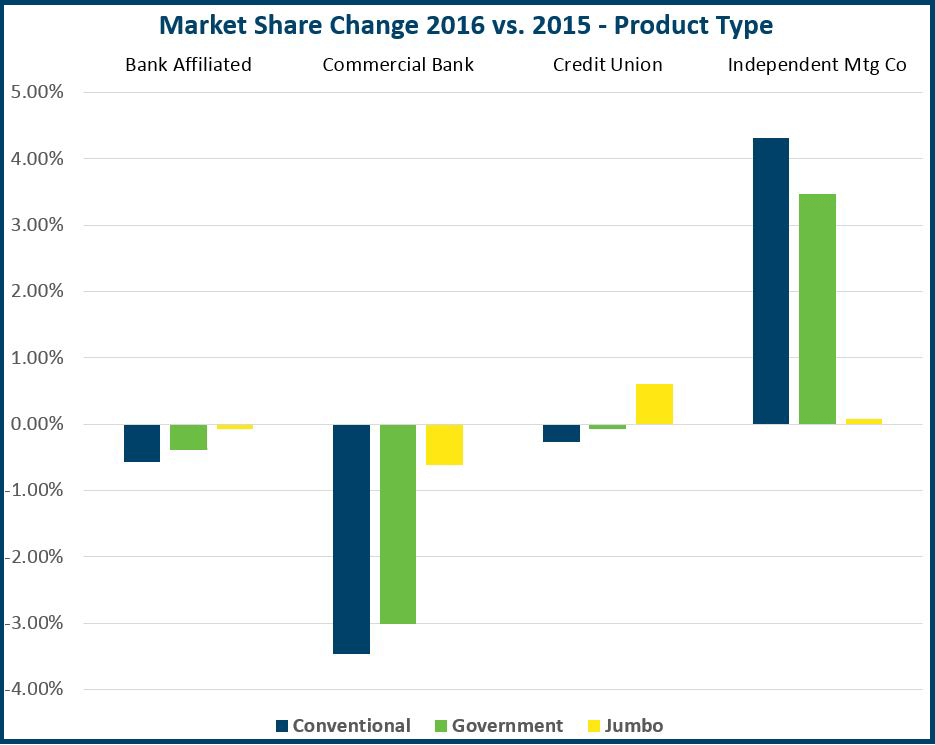
Market Share Change – Product Type
Market share by product type has shifted towards independents for conventional, government, and jumbo. The independents captured an additional 4.31% in conventional, 3.48% in gov’t, and .08% in jumbo.
The independents now have the majority market share for conventional products. Independents have 47.83% of originations for conventional products, while commercial banks trail with 40.59% (down 3.46% from 2015).
Independents continue to dominate the government products with 74.34% of the market share, while commercial banks trail with only 19.83% (down 3.02% from 2015).
Commercial banks still dominate the jumbo market with 78.16% of originations (down 0.61% from 2015), while independents trail with only 15.43%.
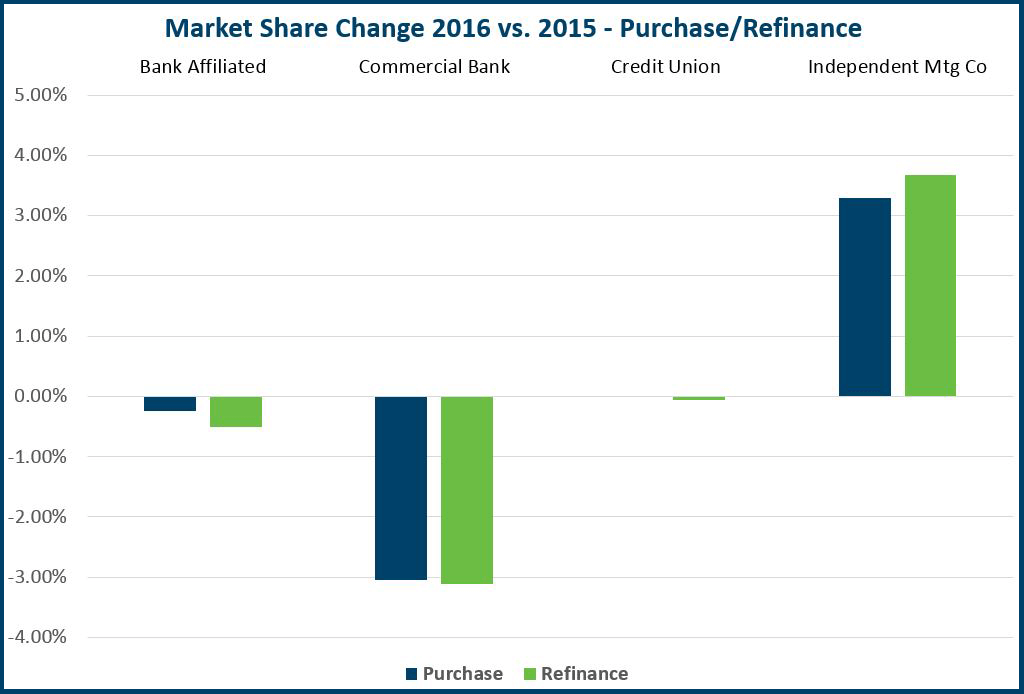
Market Share Change – Purchase/Refinance
Market share for purchase and refinance has shifted towards independents, who have captured an additional 3.30% in purchase and 3.67% in refinance.
Independents now have the majority of originations for both purchase and refinance. Independents have 46.10% of the market share for purchase, while commercial banks trail with 44.92% (down 3.04% from 2015). Independents have 46.54% of the market share for refinance, while commercial banks trail with 44.24% (down 3.11% from 2015).
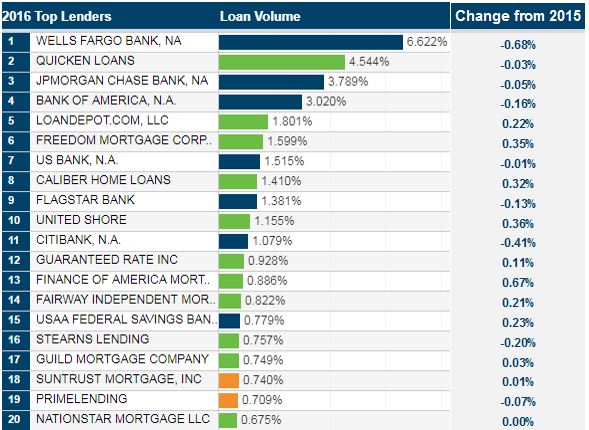
Market Share Change – Top 20 Lenders
The market share for the top 20 lenders still remains with the commercial banks. A total of seven commercial banks (down one from 2015) are in the top 20, and they make up a total of $362B in production (16.62% of the market share). While a total of 11 independents (up one from 2015) are in the top 20, and they make up a total of $305B in production (14.00% of the market share). The independents within the top 20 lenders have captured an additional 2.45% of the market share, while commercial banks within the top 20 lenders have lost 1.29% of the market share. The top 20 lenders now make up 31.95% of originations, which is up 1.15% from 2015.
Market Share Change – States
Market share shifted towards independents for all states except for North Dakota (-1.05%), and Iowa (-.35%). The states with the biggest shifts towards independents were Florida (4.76%), New Mexico (4.21%), and Colorado (4.16%).
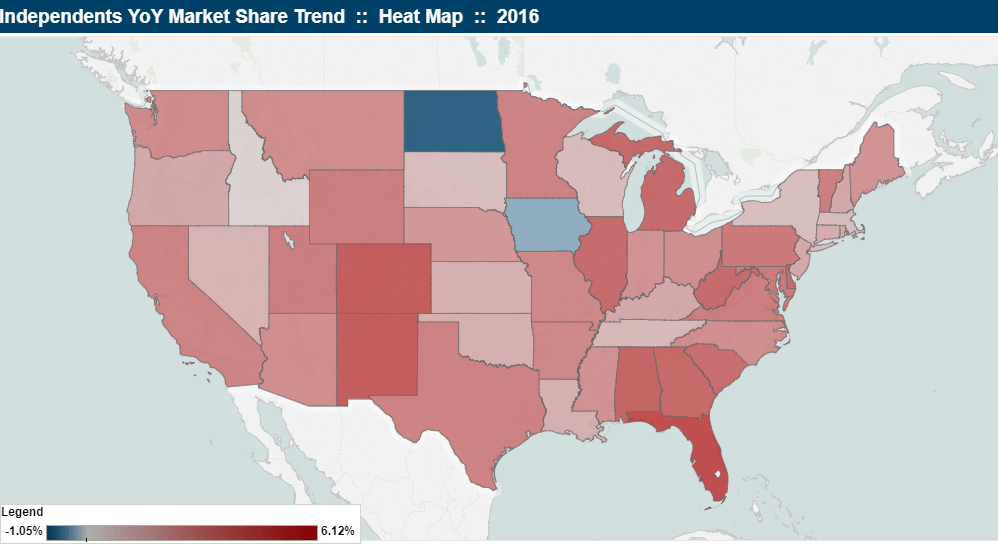
Red = independents with majority share; Blue = banks with majority share
Independent market share is more concentrated in the Western states, while commercial banks dominate the Midwest states.
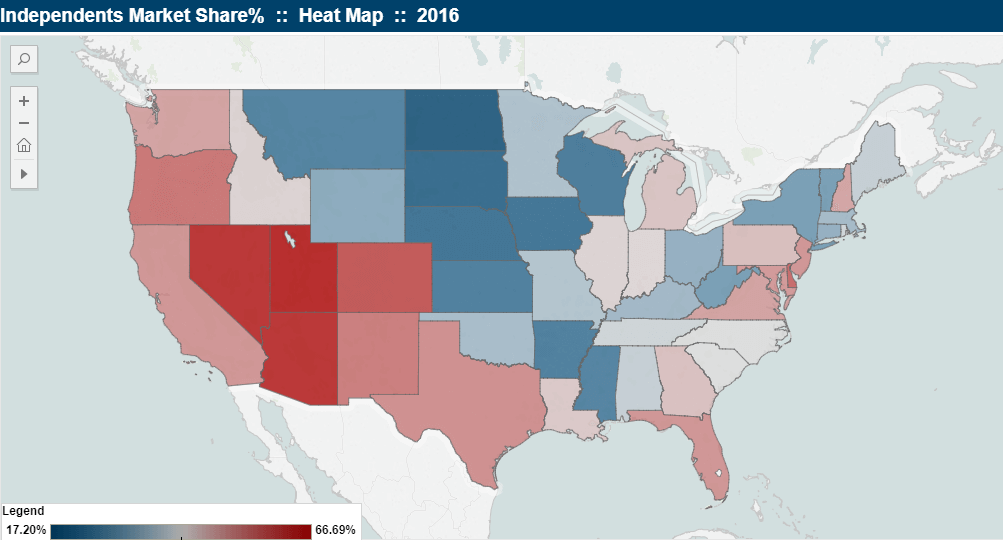
Red = independents with majority share; Blue = banks with majority share
For more information, visit our HMDA Market Share Dashboard, updated with the latest 2016 data, or contact Tyler House.